


Table of contents
This article will demonstrate how data can be analyzed, processed, and visualized with Golang. It’s a beginner-friendly tutorial and does not really require a high level of Golang expertise to follow along.
We are going to be working with a dataset of the best-selling pc games from Kaggle. You can download the dataset and save it as games.csv in your working directory to follow along.
Read dataset
The dataset we are working with has data showing the number of sales of several PC games over some time.
To start with, we need to read the dataset into our Go program. Let’s create a new entry file main.go and then create a main function and add the following snippet
From the snippet above:
We use Golang's
ospackage to open the dataset’s file by providing the name of the file as an argument and saving this dataset asfileDeclare two variables to hold the names of games and the number of sales for each game.
gameNamesis a slice ofstringwhilesalesif a slice offloat64If there is an error while reading the file, we will log the error and exit the program.
We create a new CSV reader using the
encoding/csvpackage. Here we provide the read file as an argument. We then set the LazyQuote property of the reader to true in order to add quotes on un-quoted fields in the CSV file.We then use the created reader to read the CSV file and save it as
records. If an error occurs while reading the file, we log the error and exit the program.
It should be noted here the CSV dataset will be read as records and each row is represented as an array element i.e the header will be the first element in the array and subsequently, each row follows suit.
The next thing we need to do is to format the gotten records. We create a new function to handle this. The function takes in record which is a slice of string slice[][]string and returns two variables with the same type as gameNames and sales
We create new variables as
gameName []string{}andsales []float64{}We create a
forloop here that loops over each element ofrecords. Notice how the loop starts with the 1st index and not the 0th index, this is so to remove the CSV header.We then append data to the created
gamesNamesslice. The names of games appear in the first column of the dataset, which explains why we append the 0th index of each element inrecordsr[0]We also append data to the created
salesslice. The number of sales appears in the second column of the dataset, which explains why the append the 1sh index of each element inrecordsr[1]Notice also how we convertedstringto afloat64before appending it tosales.We then return the two slices;
gameNamesandsales
From within the main function, we can now call the formatRecords function and update gameNames and sales variable accordingly like so
Dataset Mapping
Now, we need to map our records such that it is represented as a map of key/value pair with the key being the name of games, and values being the number of sales like map[string]float64{ "game1": 20.5, "game2": 3 } . We will also sort the map in descending order of the number of sales. We do this by creating another function like this;
We create a new map variable
dataMapwith key asstringand value asfloat64Loop over
gameNamesslice and for each name in the slice, we set dataMap value to the game name and the key to the value of the current index ofsales
At this point, we have been able to convert our record to a map of gameNames vs number of sales. The next thing to do is to sort the data. To do this, we will need to implement a custom sort. You can learn more about sorting in Golang here
So, what is going on here???
We create a struct type
DatawithValue(string) andKey(float64) properties. This represents the format in which our data existsWe also create a variable
DataListwhich of type[]Data.We then create three functions
Len, Swap and Less. These functions are needed to implement a custom sorting in Golang.Now, inside the
mapDatafunction, we create a new data which is a slice of typeDataListwhose length will be the length ofdataMap. We then iterate overdataMapand set populate thedataslice accordinglyWe then use the Golang’s sort package to sort the populated
data. Notice that we did a reverse sorting because we want to sort by descending order.We then return data.
We can then call the mapData function inside the main function as thus;
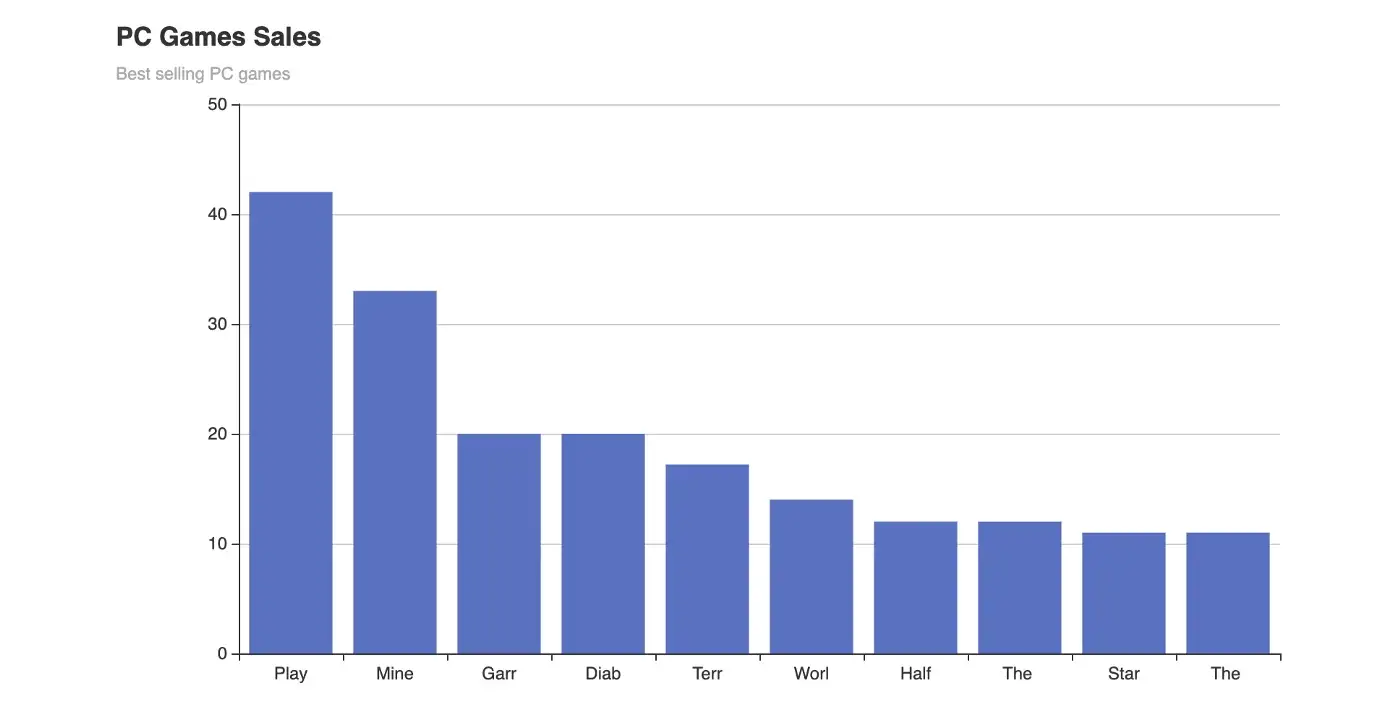
At this point, we have been able to read, analyze and clean our data. The next is to visualize the data on a chart, we will be making use of a bar chart where the X-axis will show the game names and the Y-axis shows the number of sales. To do this, we will be making use of go-echat library. This library is very good for data visualization in Golang.
We need to add the library by running
$ go get -ugithub.com/go-echarts/go-echarts/v2/.in your terminal.We will be charting only the first 10 data in the data set and remember that we have already sorted the dataset in descending order of number of sales.
So, what is happening here?
Inside the
createChartfunction, we passed the sorted data as an argument.We create a new instance of a bar chart with the go-echart library
We set some global options on the bar chart which includes the chart title and subtitle.
We set the X-axis data which is the game names and that is the keys of our sorted data map
The next thing is to generate the Y-axis data which represents the number of sales of each PC game. This is done with the new function
generateBarItemswhich takes thesortedDataas an argument. Inside this function, we iterate over thesortedDataand append bar Data accordingly. This is represented asitemsBack in the
createChartfunction, we use theCreatemethod of theospackage to create a new HTML file (games.html). We then render the chart inside the new HTML file.
With this, we have been able to generate a bar chart from our data set. You can now run go run main.go to compile and run the program. You can open the new HTML file to see the chart
So, there you have it, we have seen how we can read files (CSV), process the content of the file, and then create a chart with the file content. The code can be found in this repository. Thanks for reading.